The following are graphs produced from my sunspot counts. In each case the red lines are days where a count was made and the blue line attempts to graph the overall trend.
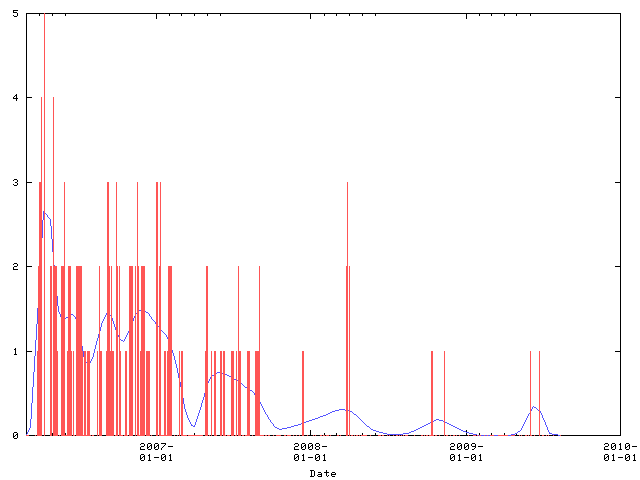
Active Area Count Graph
Number of active areas seen on the Sun.
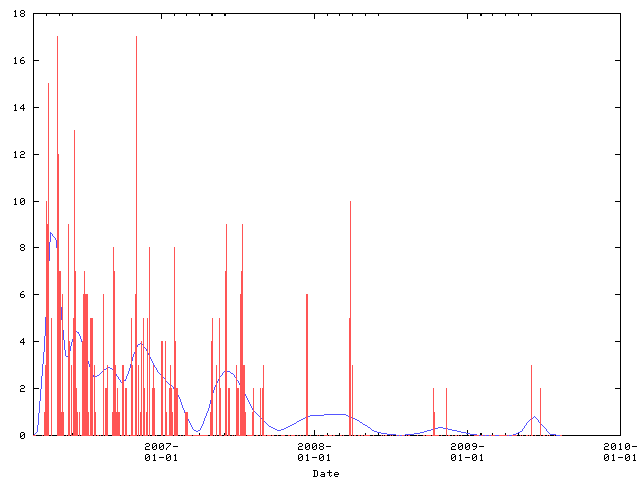
Sunspot Count Graph
Number of sunspots seen on the Sun.
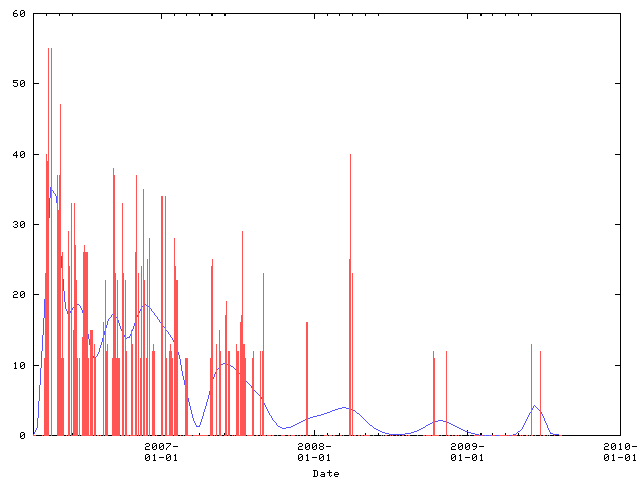
Sunspot Number Graph
Calculated
sunspot number.
The calculation is:
( Number-Of-Active-Areas * 10 ) + Number-Of-Sunspots